Sites Icon

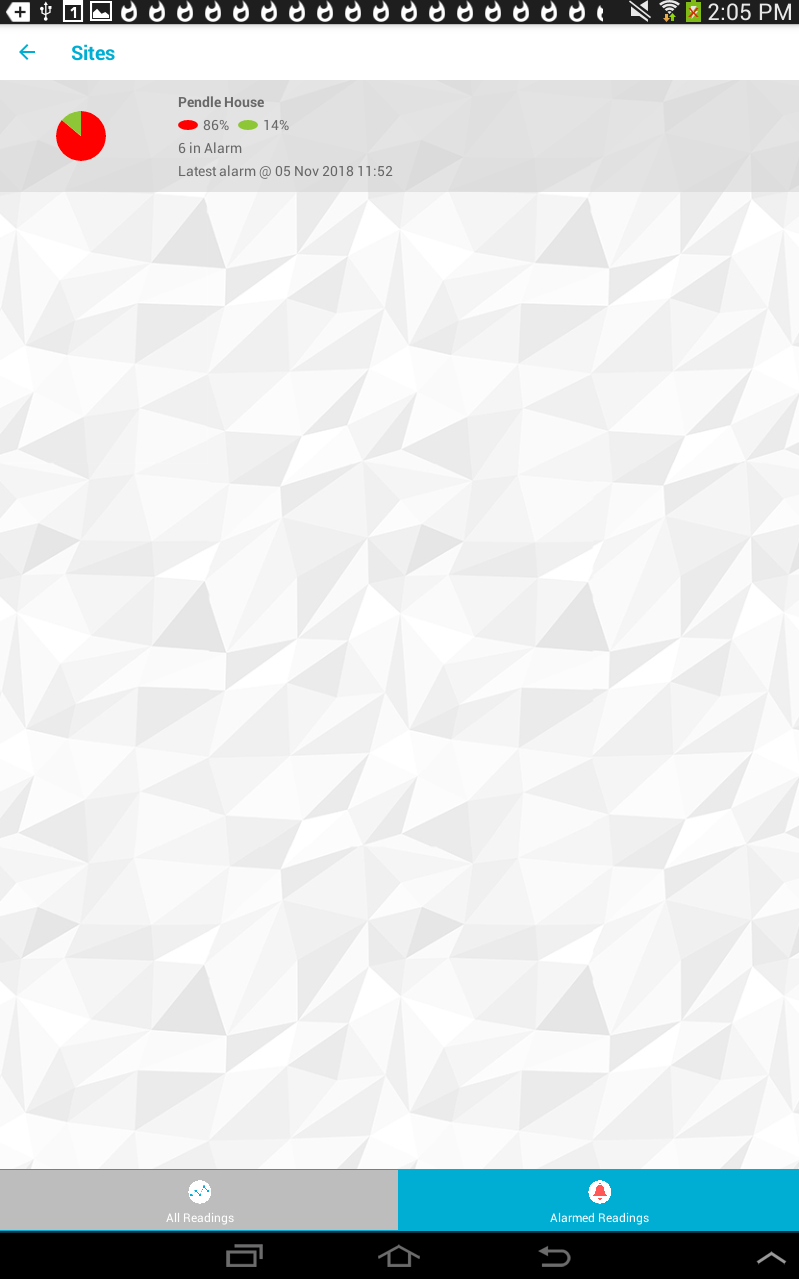
Clicking on the Sites icon on the Home screen displays a screen showing:
•A list of Sites
•A list of Sub-sites
•A list of Zones (if only one Site)
See Figure 5 below:
| Note: | The Mobile App will not show Sites' or Sub-Sites' screens directly where there is only one present. For example, if there is only one Zone and one Site - tapping on the Sites button on the Home screen would take the User to the Zone, not through a single Site screen first. |
Figure 5
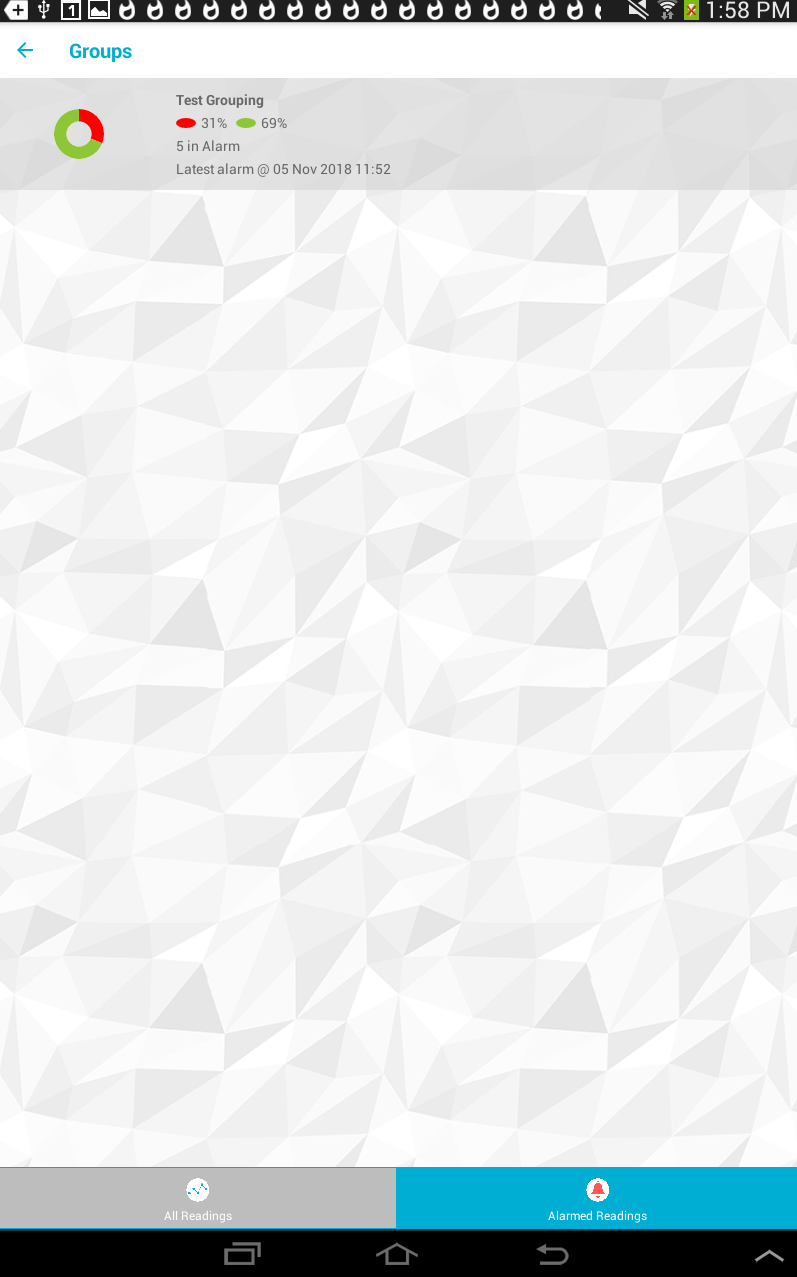
Groups Icon

Clicking on the Groups icon on the Home screen displays screen showing.
•A list of Groups
See Figure 6 below:
Figure 6
The All Readings and Alarmed Readings buttons at the bottom of either screen allow you to select whether to show all data or just data where there is an active alarm.
For each Site, Sub-site, Zone or Group displayed, there will be an associated entry showing:
•A Pie chart or a RAG (Red, Amber, Green) chart (if present in the source data) of the readings.
•The name of the Site, Sub-site, Zone or Group.
•The RAG or Pie charts' data displayed as a percentage value.
•The number of current Alarms (if there are any).
•The Date and Time of the Last alarm raised.
See Figures 7 and 8 below:
Figure 7
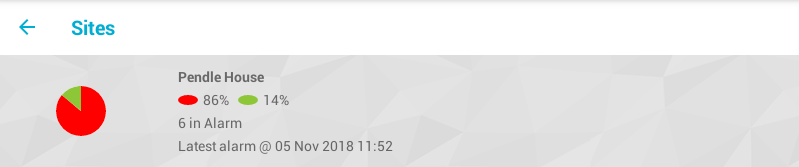
Figure 8
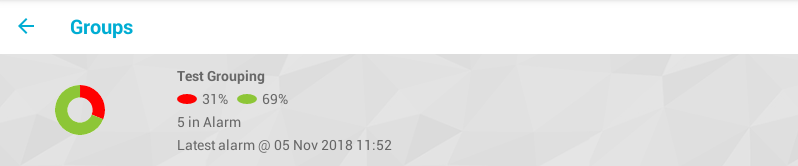
Tapping on any entry in a list, in either the Sites or Groups screen takes you to either to a new Group/Zone/RAG screen or to the Sensor Overview screen for the selected Group.