Clicking on a Site, Sub-site, Group or Zones entry on the Sites/Groups/Zones screens displays the Sensor Overview screen showing a list of Sensors associated with the selected Site, Sub-site, Group or Zone. See Figure 9 below:
Figure 9
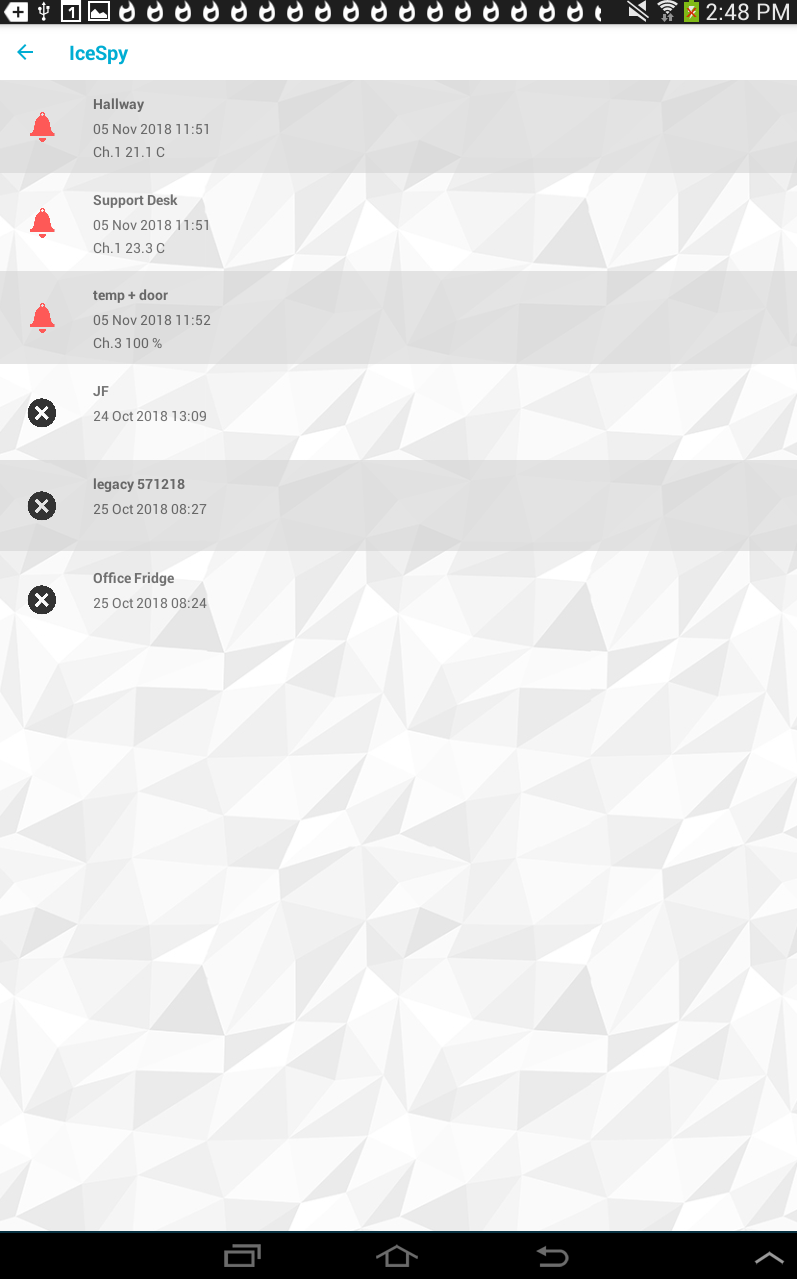
The Screen shows the following information for each Sensor:
•For Sensors in an Alarm state, the Date and Time of the Alarm and the Alarm reading.
•Red - Shows the Date and Time the Alarm was raised.
•Amber - Shows the Date and Time the Alarm was acknowledged.
•For Sensors not in an Alarm state (Green) , the last Alarm's Date and Time and the current Sensor value.
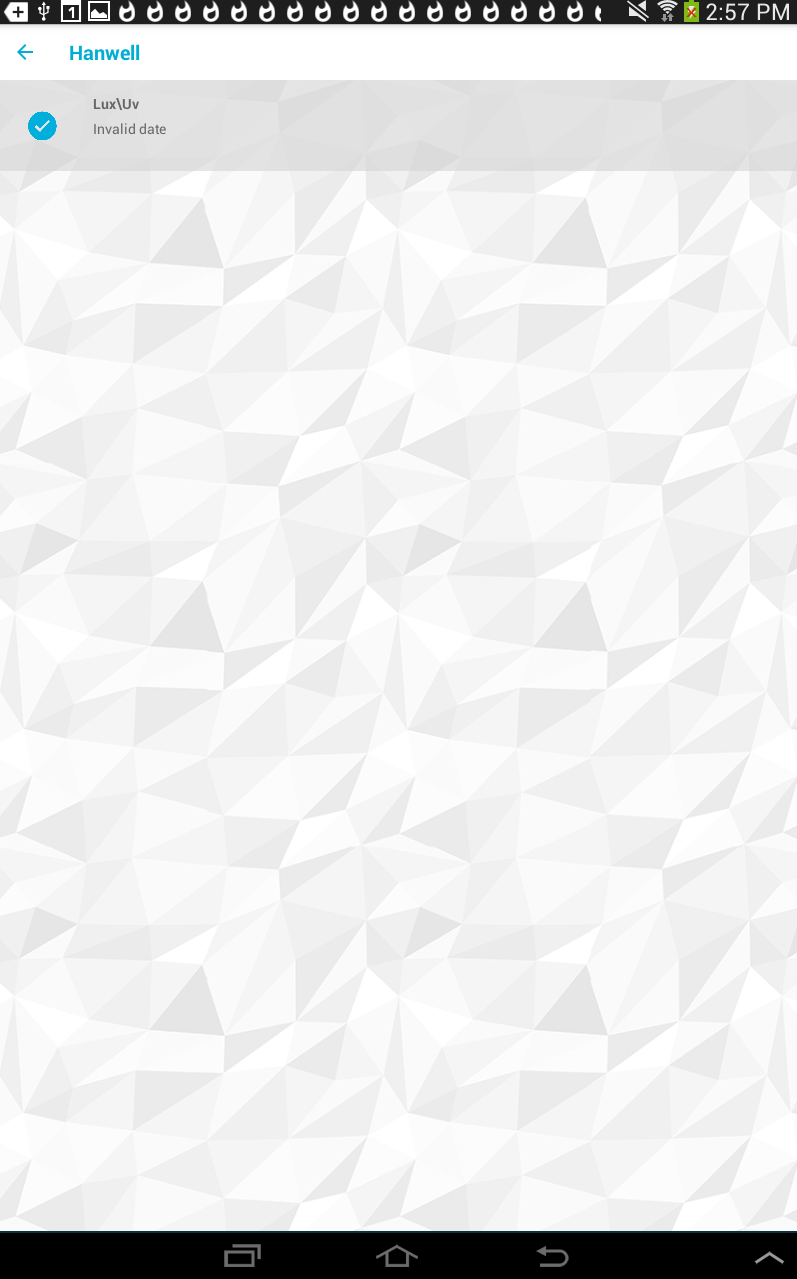
| Note: | If the selected Site, Sub-site, Group or Zone has no Sensors in Alarm, a Sensor Overview screen as shown below will be displayed, with a blue tick icon displayed next to each Sensor. |
See Figure 10 below:
Figure 10
Clicking on a Sensor's entry displays the Sensor Details window for the selected Sensor.