After logging in, you are taken to the Home screen. See Figure 1 below:
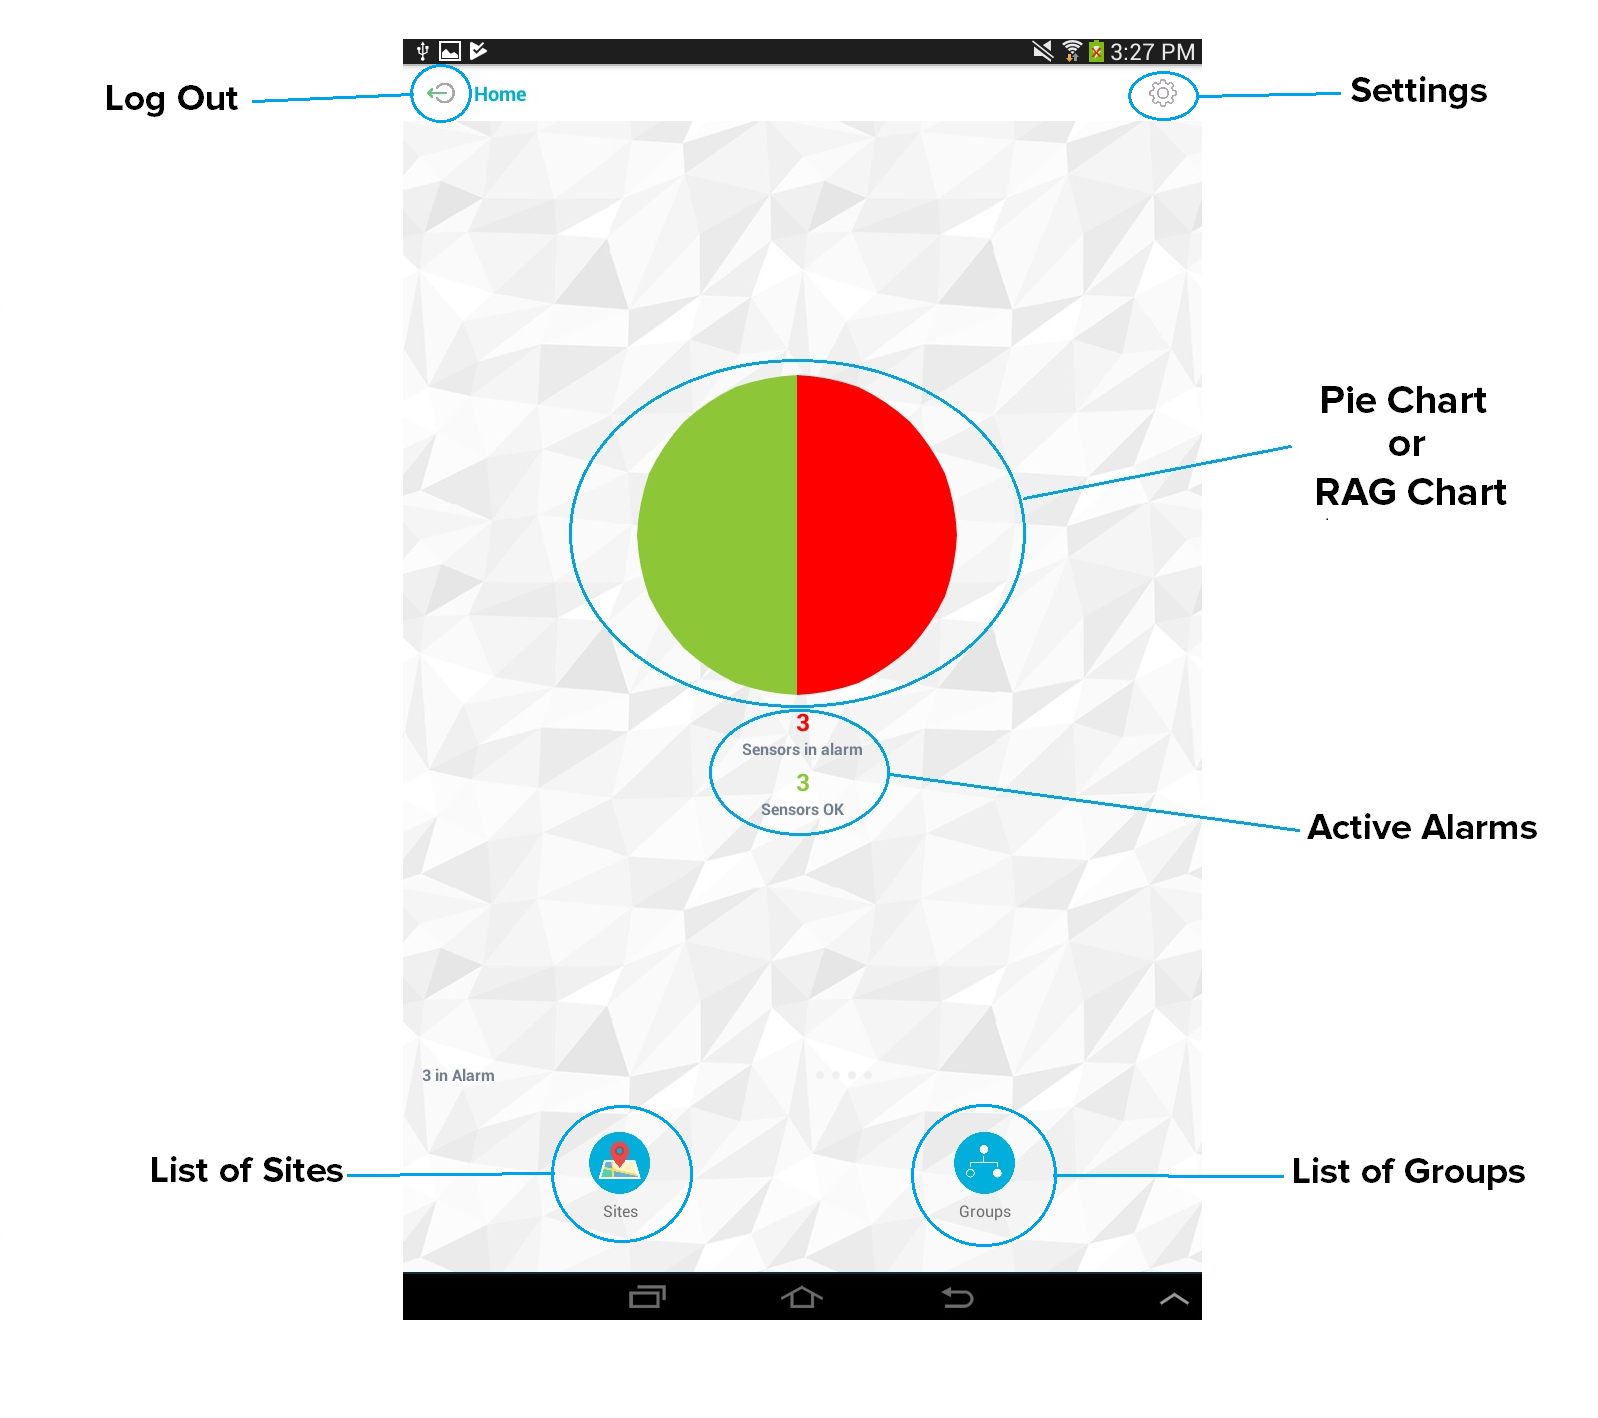
The Home screen displays fields showing:
•A RAG chart showing the Red, Amber, Green status for the entire dataset that the User is able to/allowed to see.
•The number of active alarms (Sensors in alarm/Sensors OK entry).
In addition, the Home Screen provides links to:
•Settings
Access to all App settings and also links to Support
•A list of Sites
| Note: | If there is only one Site, the single Site's Zones will be displayed. |
•A list of Groups
| Note: | All times will be presented local to the Site/Group/Zone. |