Contents
Viewing a Site's Zones
1.Click on the Sites radio button.
2.Either:
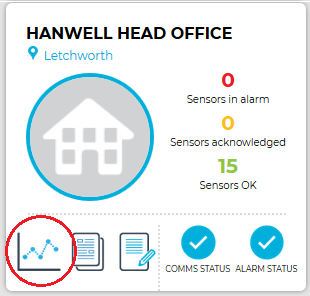
Click on the View Data icon on the relevant Site's Dashboard icon. See Figure 632 below:
Figure 632
Or:
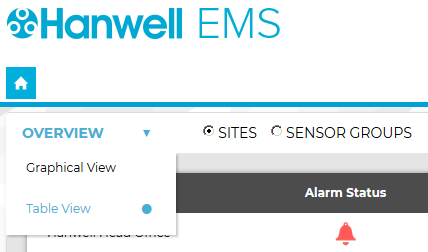
i.Select Table View from the OVERVIEW drop down menu. See Figure 633 below:
Figure 633
•The Sites Table View window is displayed. See Figure 634 below:
Figure 634
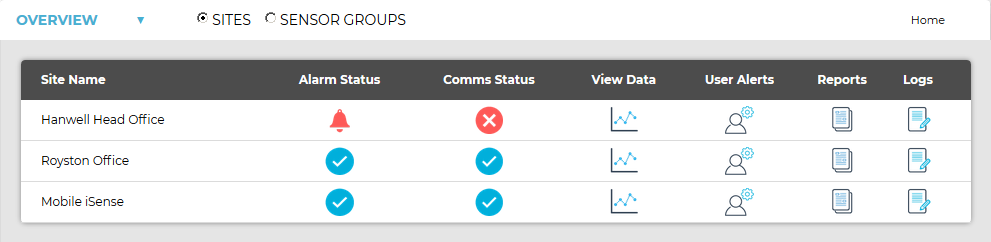
ii.On the Sites Table View window, click on the View Data icon associated with the Site you wish to view the Zones for. See Figure 635 below:
Figure 635

•In both cases, a Live View window for the selected Site is displayed, showing the Sensors associated with the first Zone listed (see 3 below). See Figure 636 below:
Figure 636
Live View Window
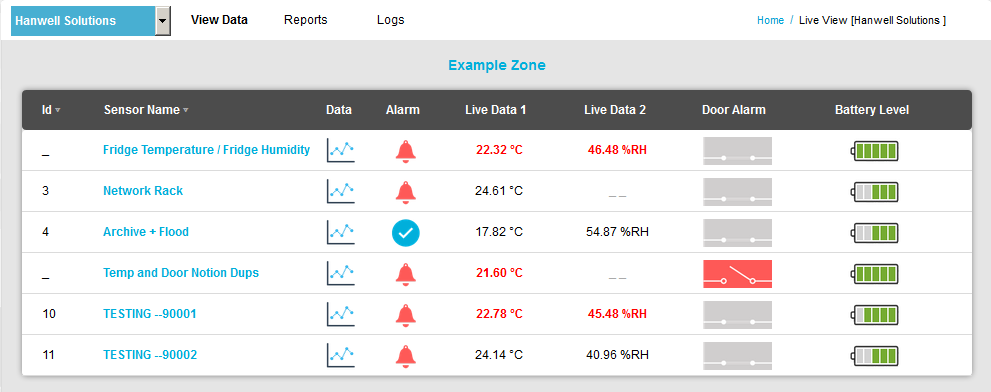
➢ To select another Zone, click here.
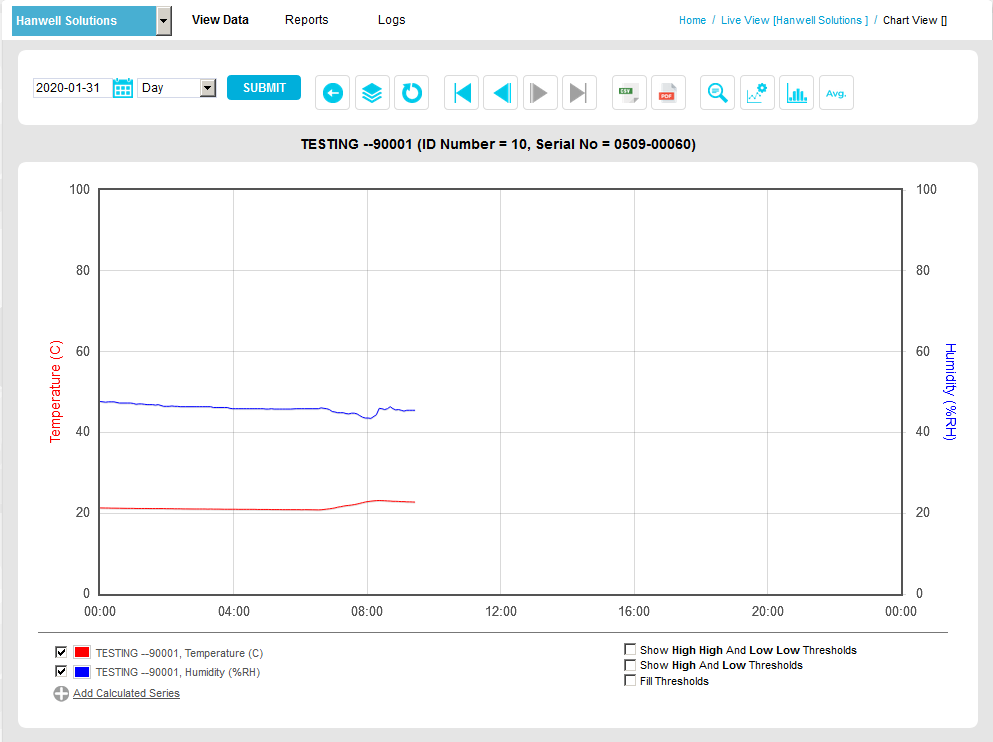
•Clicking on a Sensor's ![]() icon, in the Data column of the Zone's Live View window, displays a graph of the selected Sensor's Live data. See Figure 637 below:
icon, in the Data column of the Zone's Live View window, displays a graph of the selected Sensor's Live data. See Figure 637 below:
Figure 637
3.From the View Data drop-down menu, click on either Live View, Graph View, Plan View or Pie Chart View depending on how you wish to view the selected Zone's data. See Figure 638 below:
Figure 638
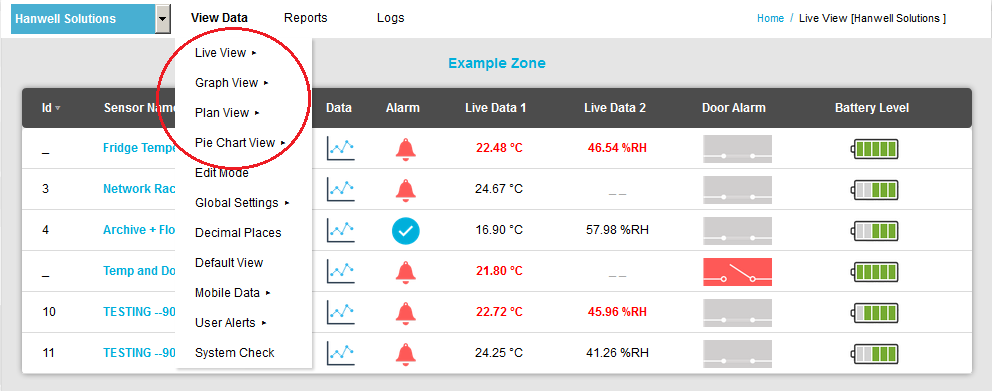
| Note: | By default, the Live View Window is shown. |
•A list of the Site's Zones is displayed in the selected drop-down menu. See Figure 639 below:
Figure 639
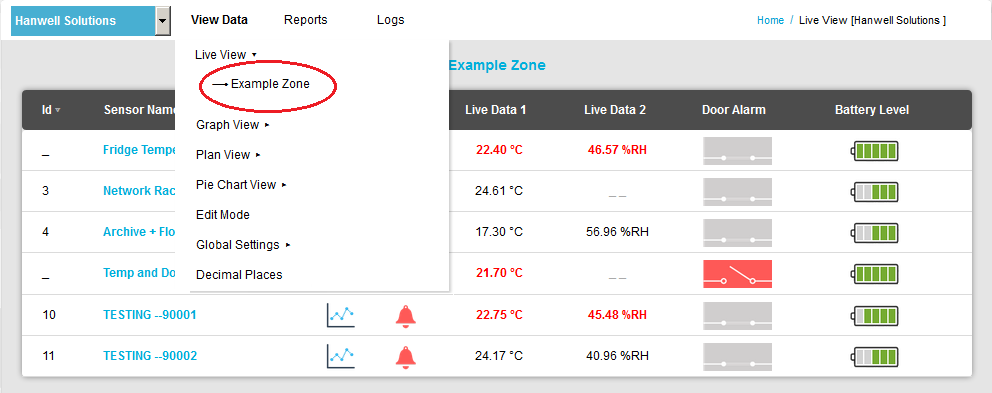
4.Select the required Zone from the displayed drop-down list to display its Sensor data in a Live View (see above), Graph View, Plan View or Pie Chart View window depending on which View was selected.
•See Figure 637 above and Figures 640, Figure 641 and Figure 642 below:
Figure 640
Graph View Window
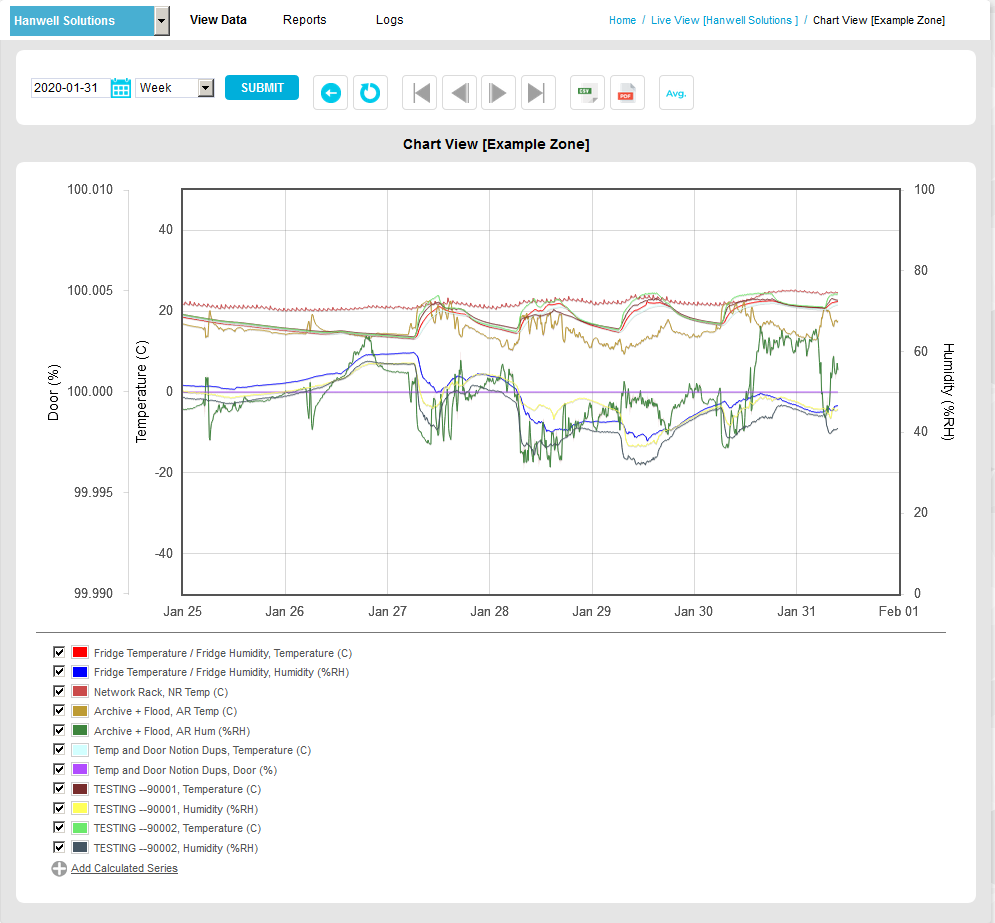
Figure 641
Plan View Window
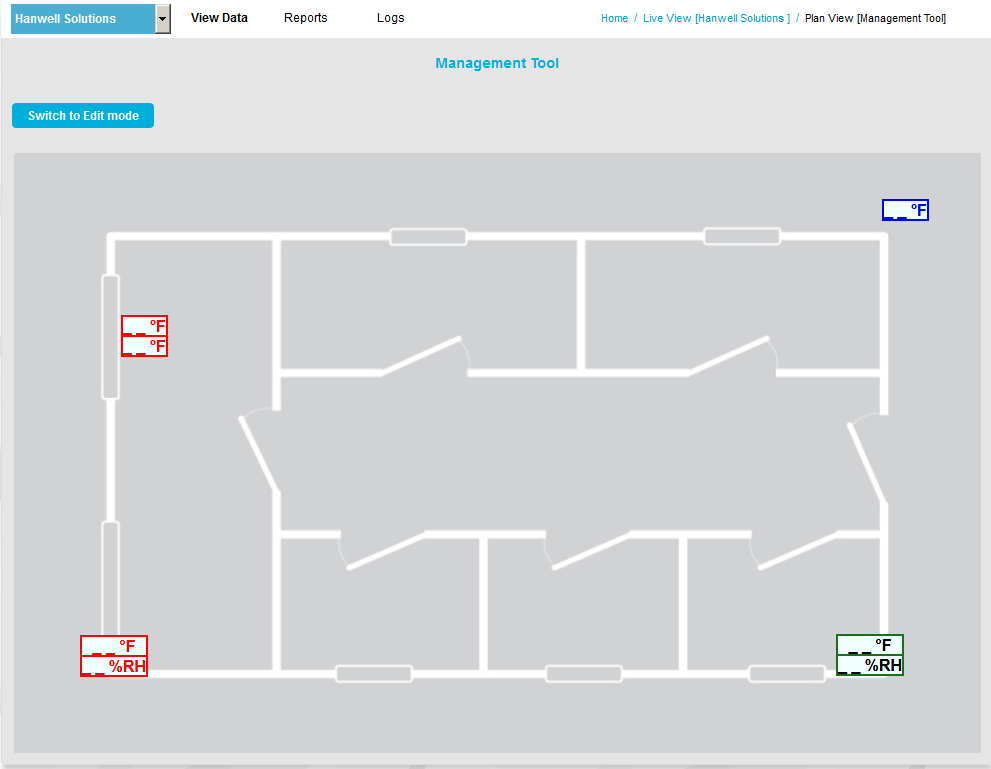
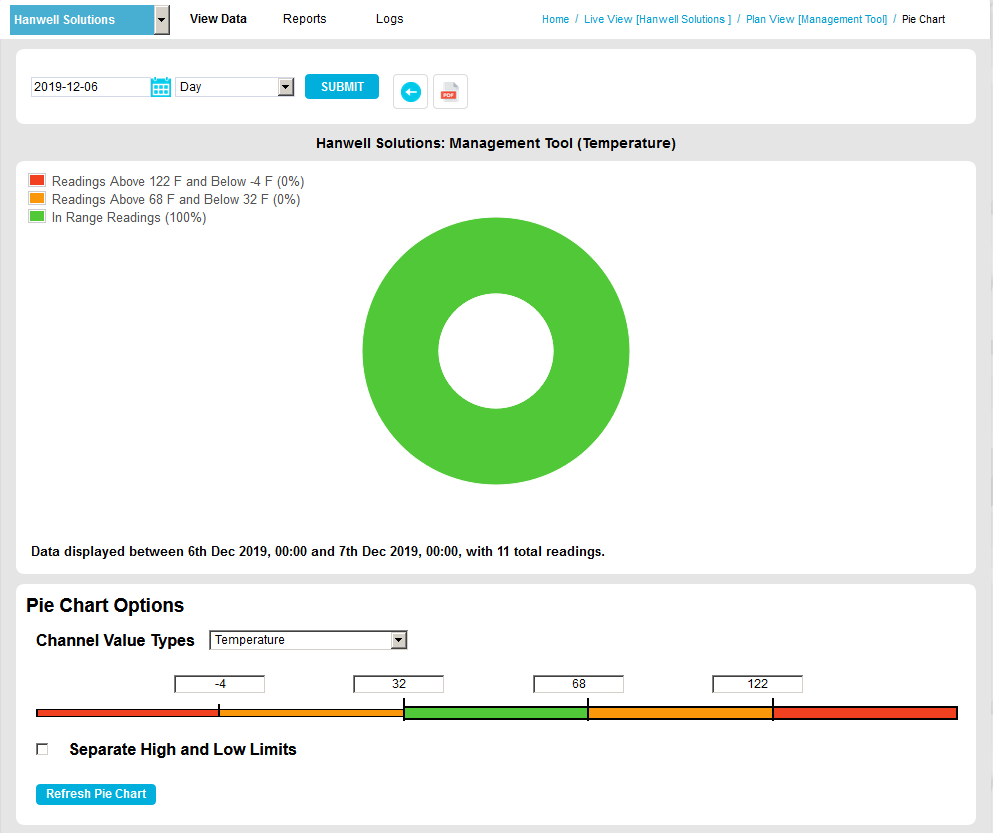
Figure 642
Pie Chart View Window