Contents
Sites are the main access points to the System Data.
•Each Site represents a single physical Site where receiving devices such as SR2 Smart Receivers, CR2 or CR3 Controllers are sited along with measuring Sensors/Transmitters.
•Sites can also have Sub-Sites associated with the main top level Site.
•Sub Sites are used where it is desirable to sub-divide a main Site; for example when there are large numbers of Sensors on a Site or many departments. Sub-Sites could be floors in a building or departments.
•When Sub-Sites are used the View Data, User Alerts, Reports and Logs are not available from the top level Site. These functions are now only available from the Sub-Sites.
•Up to six Sites can be shown on the Dashboard (Graphical View) at any one time.
When there are more than six Sites, additional Sites can be viewed in Text View.
➢Activating or Deactivating a Sub-Site's Alarms
➢Adding Sites to the Graphical Overview/Dashboard
There are two methods for viewing Sites:
Sites in Graphical View are represented by a square window, such as that opposite, which includes the following: •Site name •Picture of Site •Status Overview •System Alarm Status •Control Device status •Access to Data, Alerts, Reports and Logs
|
|
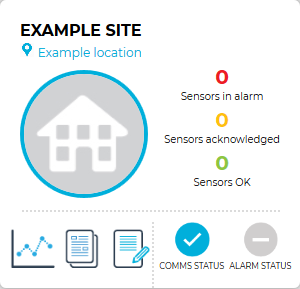
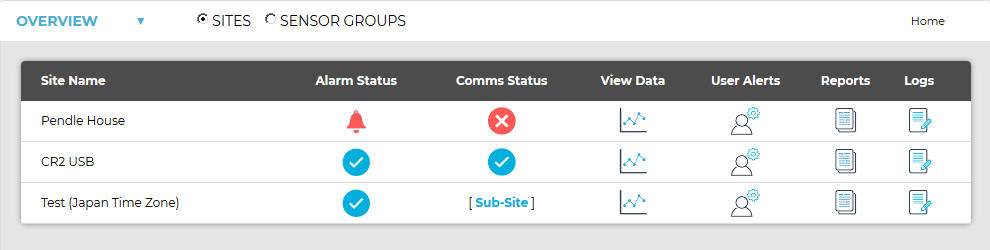
Table View has all the functionality of Graphical View, but in a more familiar text format.
•Table View is the best way to view large numbers of Sites.